
Observability Won’t Save Your AI System
Moving beyond dashboards

72% of API calls were redundant. The data was sitting right there in Langfuse — every trace, every duplicate input, every wasted dollar — for months. Nobody noticed.
This wasn’t a startup running on duct tape. It was a production extraction service with proper instrumentation, dashboards, alerts. They had observability. What they didn’t have was anyone systematically analyzing what the observability was showing them.
I see teams invest real effort getting traces flowing into Langfuse or Arize or whatever platform they’ve chosen. They build dashboards. They set up alerts on latency and error rates. Then they treat the problem as solved.
It isn’t.
The dashboard paradox
Dashboards are great at confirming what you already suspect:
Latency spiking? Check the dashboard.
Heard about an outage? Check the dashboard.
But dashboards are terrible at surfacing what you don’t know to look for.
The duplicate calls weren’t hiding. They were in plain sight — scattered across thousands of individual traces. Any engineer could have pulled the data, grouped by input hash, and seen the duplication. But why would they? The system was working. Requests went in, responses came out. The dashboard showed green.
When was the last time you looked at your traces and found something you didn’t already know?
That’s the gap. Not data collection — the tools handle that well. The gap is between having data and acting on data. Between seeing traces individually and understanding what they mean in aggregate.
We’ve been here before
The software industry went through this exact evolution over the past two decades.
First came logs. Teams shipped code and hoped for the best. When something broke, you SSH’d into a box and tailed a log file. I spent years convincing engineering leaders that widespread monitoring was worth the investment. Eventually it became table stakes.
Then came the dashboards: Nagios, Munin, then Datadog and New Relic. CPU, memory, request rates, error counts. You could see problems faster. But you still had to know what to look for.
More recently, we have open telemetry and APM (application performance monitoring). Tools that don’t just collect metrics but trace requests end-to-end, correlated events across services, and surface anomalies automatically. The shift wasn’t more data: it was smarter analysis of the data you already had.
And finally, automated remediation. Auto-scaling, self-healing infrastructure, chaos engineering. Systems that didn’t just detect problems but responded to them. Each layer built on the one before it. Nobody skipped from logs straight to auto-remediation. But nobody stopped at logs either.
AI observability is stuck at layer one
Most AI teams today are somewhere between logs and monitoring. They’ve got traces flowing. They’ve got dashboards. Some have alerts. This is genuinely important work — platforms like Langfuse have made it dramatically easier to see what’s happening inside LLM-powered systems.
But it’s layer one.
A single trace looks fine. Ten thousand traces reveal that 40% of your spend goes to resending the same system prompt on every conversational turn. Your error rate is 5% overall — sounds acceptable — until you break it apart and find one pipeline step fails 40% of the time, masked by the steps that never fail. You know your monthly LLM bill, but not which workflow drives it, which model version inflates it, or which operations could drop to a cheaper model without quality loss.
Your system worked great three months ago. Something changed — a model version, a data distribution, a prompt template — and quality degraded slowly enough that no alert fired. Layer one doesn’t watch for gradual shifts. It watches for threshold breaches.
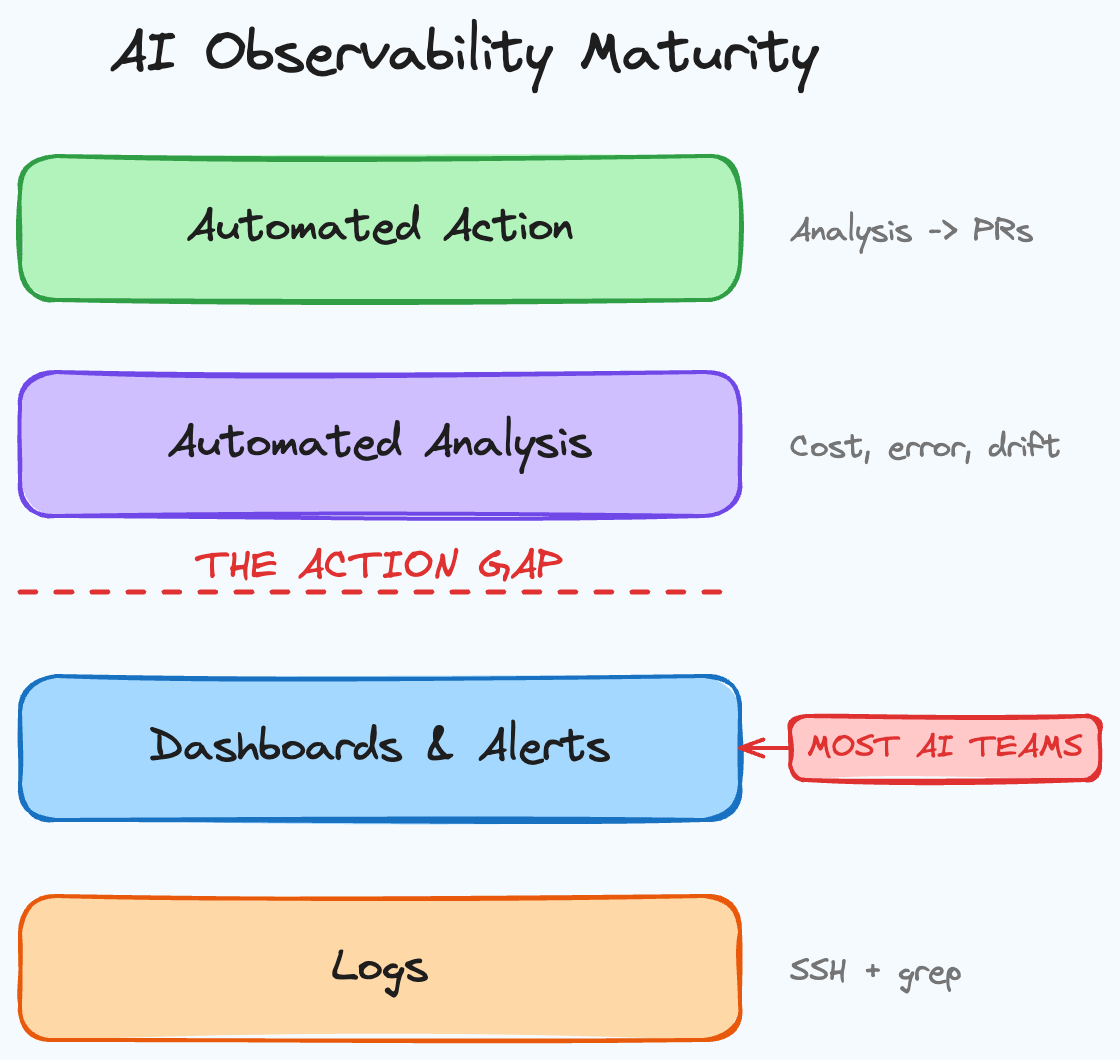
The action gap
I’ve analyzed traces from lots of production AI systems and the pattern is remarkably consistent: every project has observability in place, and every project has obvious optimization opportunities sitting unnoticed in the data.
The median finding is 30–60% cost savings from fixes that take less than an hour. A response cache here. A model downgrade there. A prompt caching config change. Pin a model version instead of running five old ones simultaneously.
These aren’t exotic fixes. They’re the kind of thing any senior engineer would implement immediately — if someone pointed them out. The problem isn’t capability. It’s attention. Nobody’s job is to stare at every trace and notice that the same input keeps showing up.
Observability tells you what happened. Analysis tells you what it means. The layer most teams are missing is the one that turns analysis into specific, prioritized actions.
What the next layer looks like
The APM analogy isn’t just historical color. It’s predictive. The same evolutionary pressure that pushed software monitoring toward automated analysis is now pushing AI observability in the same direction.
Layer two is automated analysis. Not more dashboards — systematic examination of traces that surfaces patterns humans miss. Redundancy detection. Cost decomposition. Error clustering. Quality drift measurement. The kind of analysis you’d do if you had infinite time and perfect attention, run continuously against your production data.
Layer three is automated action. Analysis produces recommendations. Recommendations become pull requests. A system that doesn’t just tell you “you’re spending too much on model X” but opens a PR that swaps it for a cheaper alternative and shows you the quality comparison.
We’re not at layer three yet. But layer two is here, and most teams haven’t adopted it.
The uncomfortable question
When was the last time you did a systematic analysis of your traces? Not a dashboard check. Not an incident investigation. A deliberate, comprehensive review of what your system is actually doing.
If the answer is “never” or “I’m not sure,” you’re not alone. That’s almost everyone. And it means there are patterns in your data — waste, errors, drift — that you haven’t found yet.
Observability was the right first step. But the teams that pull ahead won’t be the ones with the best dashboards. They’ll be the ones that close the gap between seeing and acting.